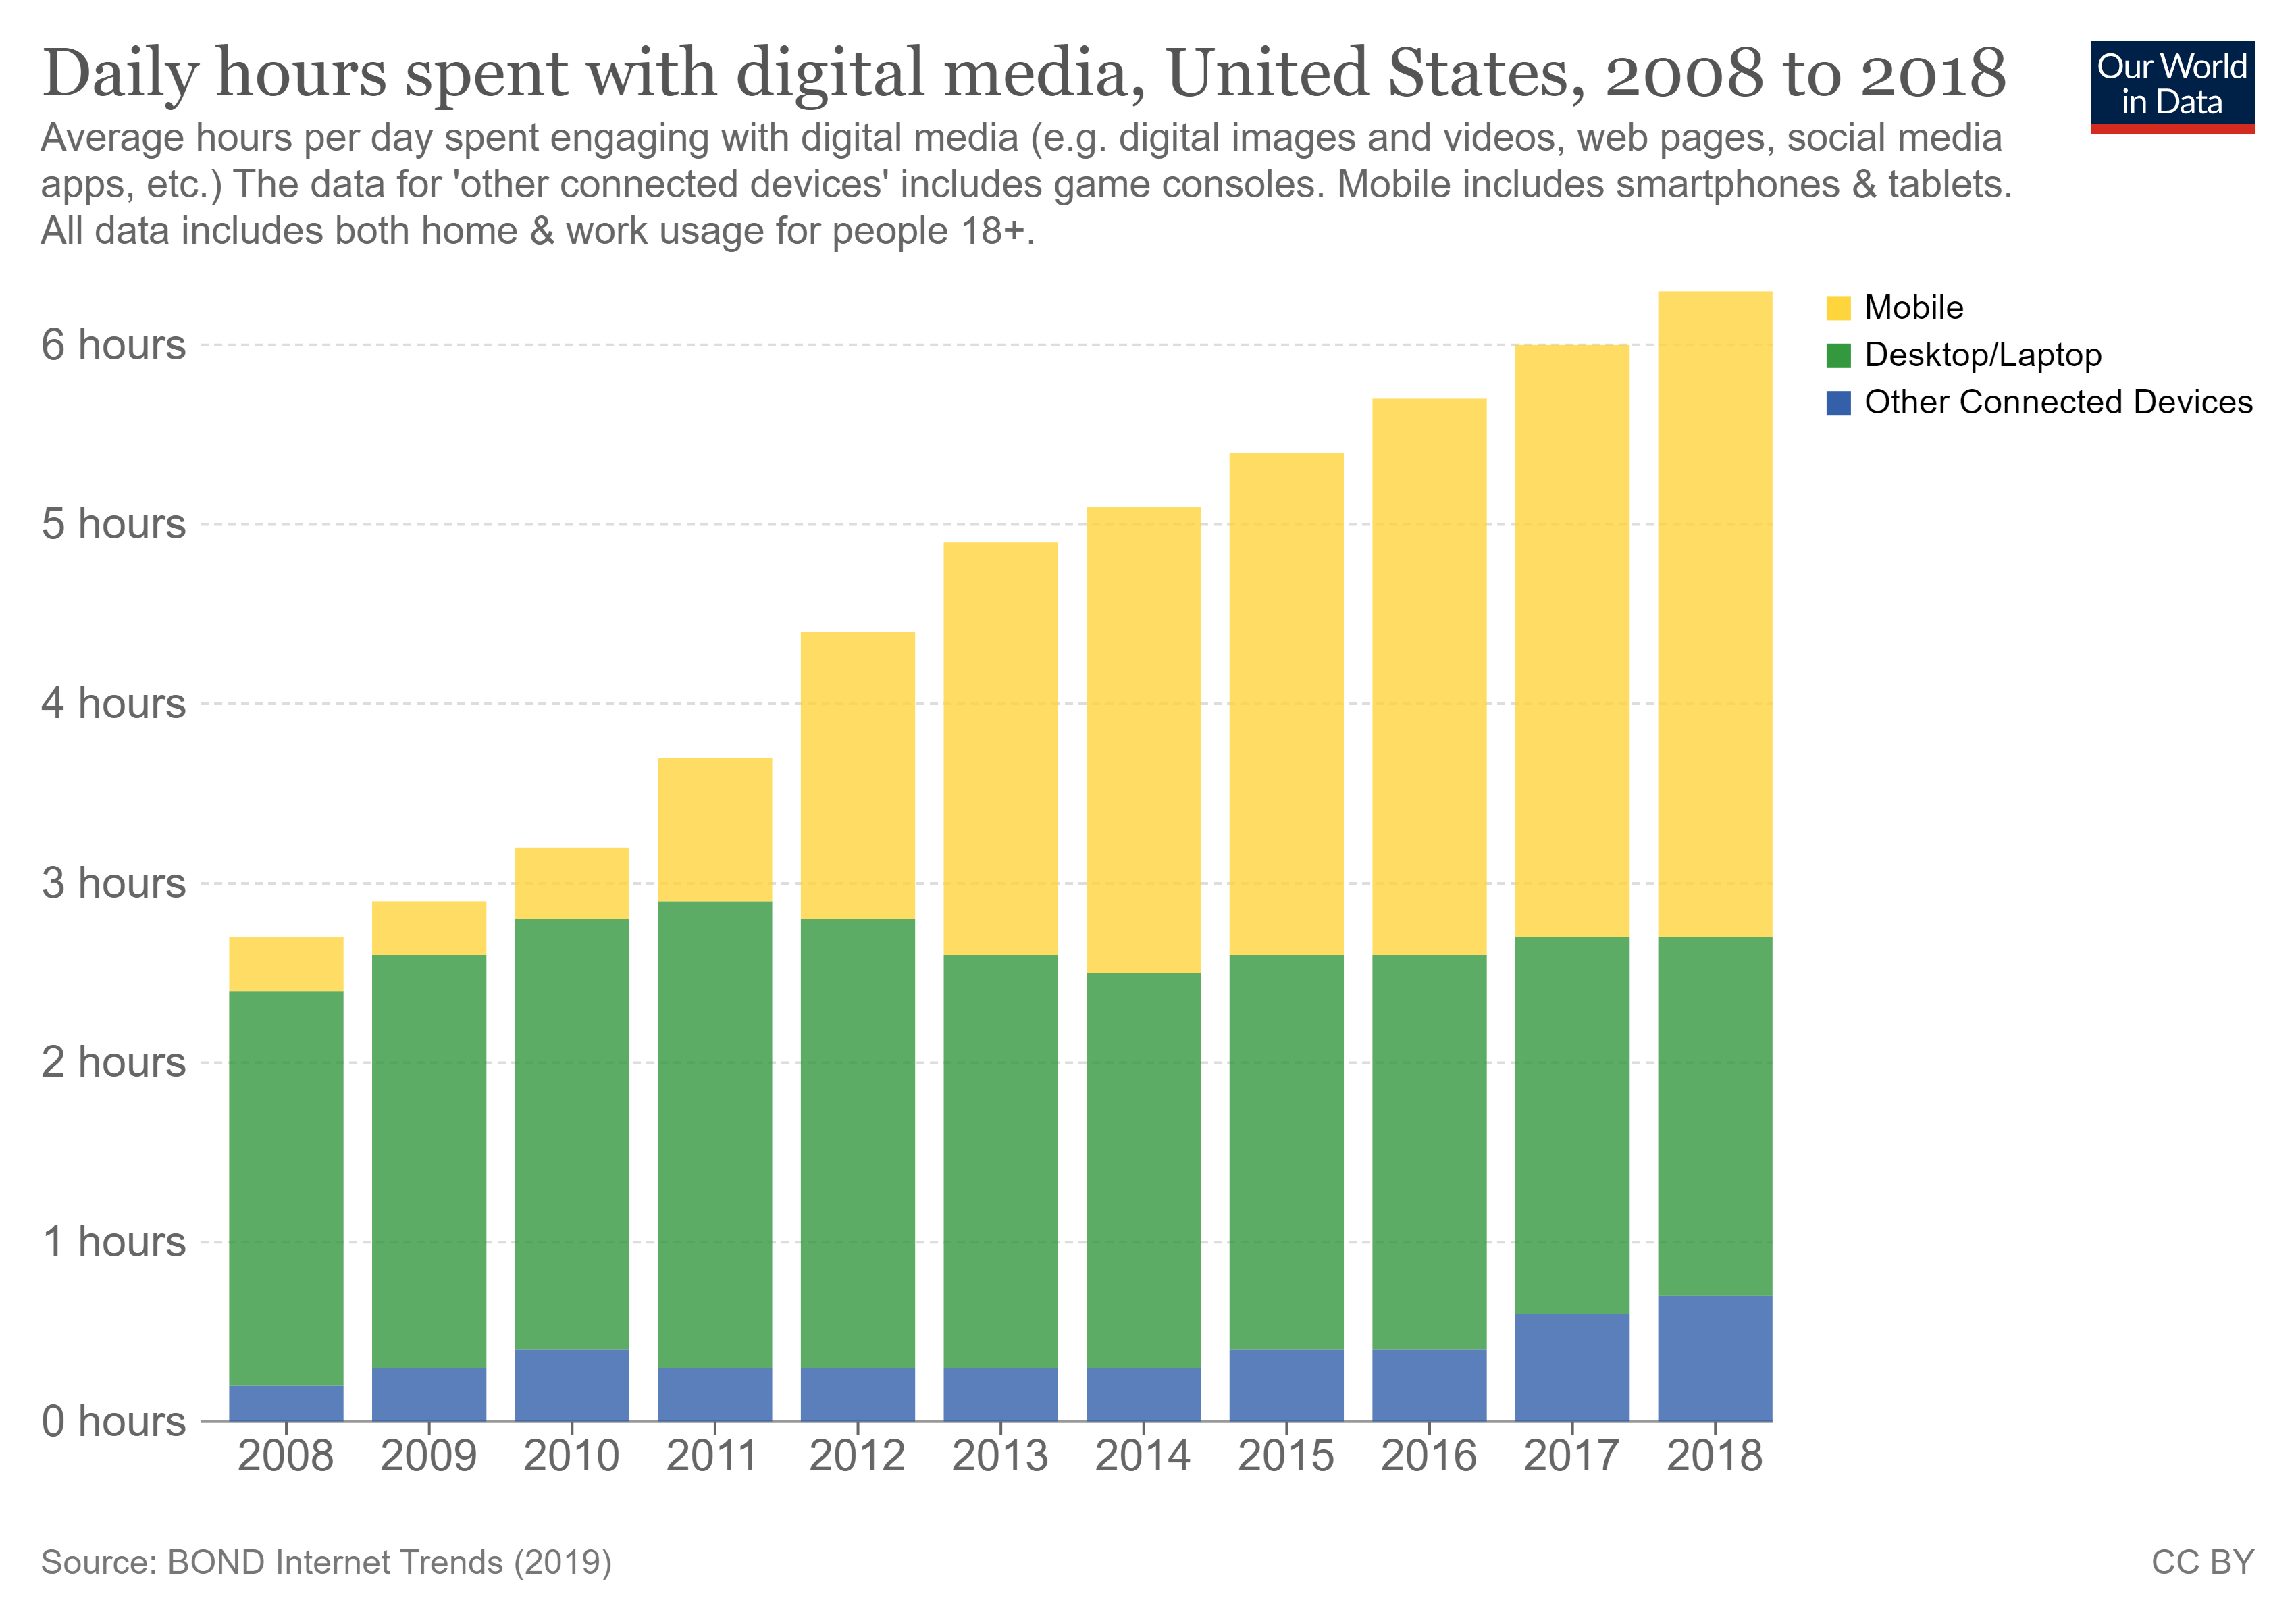
I downloaded hours spent with digital media data from Our World in Data. I selected this data because I’m interested in the daily hours spent with digital media from 2008 through 2018.
This is the link to the data.
3, The following code chunk loads the package I will use to read in and prepare the data for analysis.
- Read the data in
- Use glimpse to see the names and types of the columns
glimpse(daily_hours_spent_with_digital_media_per_adult_user)
Rows: 11
Columns: 6
$ Entity                                                  <chr> "Uni~
$ Code                                                    <chr> "USA~
$ Year                                                    <dbl> 2008~
$ `Mobile (BOND Internet Trends (2019))`                  <dbl> 0.3,~
$ `Desktop/Laptop (BOND Internet Trends (2019))`          <dbl> 2.2,~
$ `Other Connected Devices (BOND Internet Trends (2019))` <dbl> 0.2,~View(daily_hours_spent_with_digital_media_per_adult_user)
- Use output from glimpse (and View) to prepare the data for analysis
Create the object
digital_mediathat is list of digital_media I want to extract from the datasetChange the name of 1st column to Digital_Media, the 4th column to Mobile, the 5th column to Desktop_Laptop, and the 6th column to Other_Connected_Devices
Use filter to extract the rows that I want to keep: Year >= 2008 and Digital_Media in digital_media
Select the columns to keep: Digital_Media, Year, Mobile, Desktop_Laptop, Other_Connected_Devices
Assign the output to daily_hours_spent
Display the first 10 rows of daily_hours_spent
digital_media <- c("Mobile",
                   "Desktop/Laptop",
                   "Other Connected Devices")

daily_hours_spent <- daily_hours_spent_with_digital_media_per_adult_user %>%
  rename(Digital_Media = 1, Mobile = 4, Desktop_Laptop = 5, Other_Connected_Devices = 6) %>%
  filter(Year >= 2008, Digital_Media %in% digital_media) %>%
  select(Digital_Media, Year, Mobile, Desktop_Laptop, Other_Connected_Devices)

daily_hours_spent
# A tibble: 0 x 5
# ... with 5 variables: Digital_Media <chr>, Year <dbl>,
#   Mobile <dbl>, Desktop_Laptop <dbl>, Other_Connected_Devices <dbl>
Add a picture.
Write the data to file in the project directory
write_csv(daily_hours_spent, file="daily_hours_spent.csv")